Category Archives: Crime

18 of America’s 20 worst cities are run by Democrats

WalletHub compared the operating efficiency of 150 of the largest U.S. cities to determine which among them are managed best, based on a “Quality of Services” score made up of 38 metrics grouped into 6 service categories:

  1. Financial stability
  2. Education
  3. Health
  4. Safety
  5. Economy
  6. Infrastructure and Pollution

Each city’s “Quality of Services” score is then measured against the city’s per-capita budget. (To find out more about WalletHub’s methodology, go here.)

Source: WalletHub

No surprise to us, Los Angeles, CA (#134), Chicago, IL (#141), Oakland, CA (#144), Detroit, MI (#145), New York, NY (#148), San Francisco, CA (#149), and Washington, DC (#15o) are ranked among the worst — all governed by Democrats.

In fact, 18 of the 20 worst managed cities have Democrat mayors. The two exceptions are #146 Gulfport, TN (Republican mayor Billy Hewes) and #147 Chattanooga, TN (Independent mayor Tim Kelly).

But that fact won’t deter the voters of those cities to reelect Democrats, which is a sure indicator of their mental illness.

Here’s the list of the 150 cities, ranked from best (#1) to worst (#150):

Overall Rank (1=Best)  City ‘Quality of City Services’ Rank  ‘Total Budget per Capita’ Rank 
1 Nampa, ID 23 1
2 Boise, ID 4 3
3 Fort Wayne, IN 63 2
4 Nashua, NH 5 9
5 Lexington-Fayette, KY 44 6
6 Lincoln, NE 8 19
7 Durham, NC 25 11
8 Rapid City, SD 81 4
9 Las Cruces, NM 65 5
10 Virginia Beach, VA 2 36
11 Raleigh, NC 11 29
12 Missoula, MT 67 12
13 Oklahoma City, OK 88 8
14 Manchester, NH 29 20
15 Provo, UT 3 38
16 Sioux Falls, SD 31 21
17 Billings, MT 86 13
18 Madison, WI 6 42
19 Chesapeake, VA 17 34
20 Huntington Beach, CA 1 55
21 Louisville, KY 80 17
22 Greensboro, NC 57 23
23 Arlington, TX 28 31
24 Salem, OR 54 26
25 Mesa, AZ 58 25
26 Bismarck, ND 12 48
27 Charleston, SC 15 44
28 Columbus, GA 95 16
29 Cedar Rapids, IA 34 39
30 Warwick, RI 26 43
31 Albuquerque, NM 127 10
32 Tucson, AZ 111 14
33 Warren, MI 74 28
34 Huntington, WV 114 15
35 Aurora, IL 51 37
36 Phoenix, AZ 65 35
37 Grand Rapids, MI 33 47
38 Lewiston, ME 85 30
39 Tulsa, OK 110 22
40 Topeka, KS 76 40
41 Reno, NV 43 49
42 Worcester, MA 48 52
43 St. Petersburg, FL 42 54
44 Mobile, AL 96 32
45 Fort Worth, TX 56 53
46 El Paso, TX 64 50
47 Wichita, KS 124 24
48 Portland, ME 21 69
49 Corpus Christi, TX 99 41
50 Colorado Springs, CO 78 51
51 Baton Rouge, LA 129 27
52 Las Vegas, NV 49 61
53 Aurora, CO 79 56
54 Gary, IN 141 18
55 Fairbanks, AK 102 45
56 Des Moines, IA 53 62
57 Eugene, OR 38 71
58 Fort Smith, AR 123 33
59 Rutland, VT 59 67
60 Fargo, ND 35 79
61 Spokane, WA 60 68
62 San Diego, CA 7 97
63 Santa Ana, CA 39 81
64 Jackson, MS 148 7
65 Omaha, NE 27 86
66 Little Rock, AR 122 46
67 Hialeah, FL 55 78
68 Indianapolis, IN 93 60
69 Portland, OR 19 95
70 Boston, MA 14 100
71 Akron, OH 97 65
72 Montgomery, AL 119 58
73 Garland, TX 52 89
74 Salt Lake City, UT 16 106
75 Anchorage, AK 83 82
76 Tallahassee, FL 73 85
77 Fremont, CA 13 113
78 Houston, TX 100 73
79 Jacksonville, FL 109 70
80 Frederick, MD 22 108
81 Dayton, OH 101 74
82 Austin, TX 10 117
83 Columbia, SC 103 76
84 Dover, DE 120 64
85 Springfield, MA 121 63
86 Miami, FL 50 96
87 Casper, WY 104 80
88 Tampa, FL 40 101
89 Providence, RI 116 72
90 San Antonio, TX 47 103
91 St. Paul, MN 45 104
92 Columbus, OH 82 92
93 New Orleans, LA 136 57
94 San Jose, CA 20 121
95 Dallas, TX 89 93
96 Burlington, VT 32 114
97 Norfolk, VA 107 88
98 Charleston, WV 128 77
99 Bridgeport, CT 117 83
100 Richmond, VA 87 98
101 Kansas City, MO 112 91
102 Anaheim, CA 69 111
103 Cincinnati, OH 72 112
104 Fort Lauderdale, FL 41 120
105 Charlotte, NC 24 126
106 Toledo, OH 142 66
107 Orlando, FL 61 118
108 Bakersfield, CA 130 86
109 Shreveport, LA 147 59
110 Milwaukee, WI 126 90
111 Nashville, TN 105 105
112 Lubbock, TX 118 101
113 Knoxville, TN 46 130
114 Seattle, WA 9 140
115 Minneapolis, MN 37 133
116 Modesto, CA 108 109
117 Stockton, CA 145 75
118 Birmingham, AL 132 94
119 Syracuse, NY 84 123
120 Sacramento, CA 92 122
121 Pittsburgh, PA 68 129
122 Buffalo, NY 91 125
123 Riverside, CA 90 127
124 Atlanta, GA 77 132
125 Wilmington, DE 113 119
126 Fresno, CA 133 107
127 Long Beach, CA 62 139
128 Baltimore, MD 135 110
129 Cheyenne, WY 98 135
130 Denver, CO 71 141
131 Kansas City, KS 138 116
132 St. Louis, MO 149 84
133 Memphis, TN 143 115
134 Los Angeles, CA 75 143
135 New Haven, CT 137 124
136 Yonkers, NY 70 144
137 Philadelphia, PA 134 128
138 Rochester, NY 115 138
139 Tacoma, WA 106 142
140 Hartford, CT 144 131
141 Chicago, IL 140 136
142 Cleveland, OH 139 137
143 Flint, MI 146 134
144 Oakland, CA 94 147
145 Detroit, MI 150 99
146 Gulfport, MS 125 145
147 Chattanooga, TN 131 146
148 New York, NY 36 148
149 San Francisco, CA 18 149
150 Washington, DC 30 150

~E

10 most dangerous states and cities in America

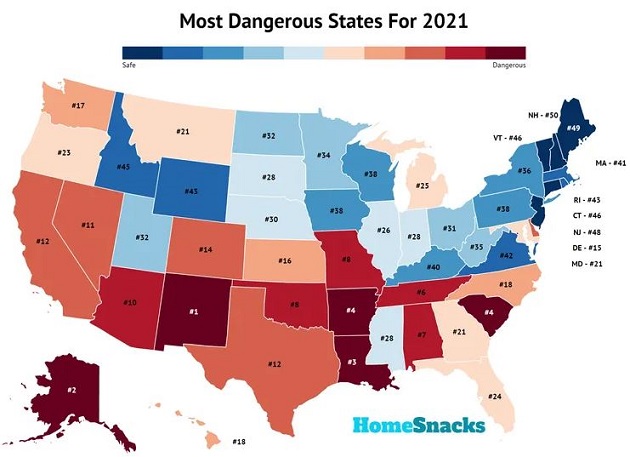
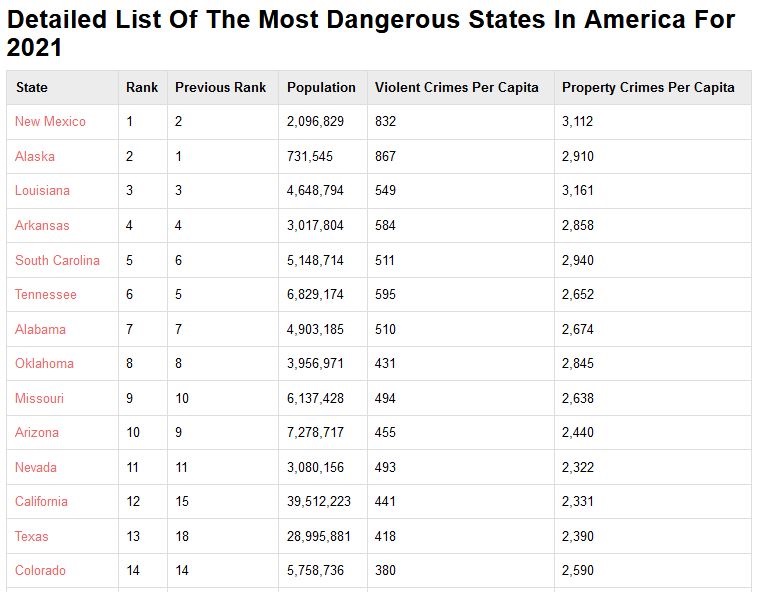
RoadSnacks has issued the 10 Most Dangerous States in America for 2021 — defined as states with the highest number of violent and property crimes per capita, according to FBI’s 2019 Crime Report. The FBI, in turn, derived its crime data from the states.

RoadSnacks‘ methodology:

  • Each state is ranked from 1 to 50 for the two criteria (violent crimes; property crimes), 1 being most dangerous.
  • The two rankings for each state is then averaged into a “Danger Index”.
  • The state with the lowest Danger Index is the most dangerous state in America for 2021.

Here’s the 10 most dangerous states in America, 2021:

  1. New Mexico: 832 violent crimes per 100,000 population; 3,112 property crimes per 100,000 population.
  2. Alaska: 867 violent crimes per 100,000 population; 2,910 property crimes per 100,000 population.
  3. Louisiana: 549 violent crimes per 100,000 population; 3,161 property crimes per 100,000 population.
  4. Arkansas: 584 violent crimes per 100,000 population; 2,858 property crimes per 100,000 population.
  5. South Carolina: 511 violent crimes per 100,000 population; 2,940 property crimes per 100,000 population.
  6. Tennessee: 595 violent crimes per 100,000 population; 2,652 property crimes per 100,000 population.
  7. Alabama: 510 violent crimes per 100,000 population; 2,674 property crimes per 100,000 population.
  8. Oklahoma: 431 violent crimes per 100,000 population; 2,845 property crimes per 100,000 population.
  9. Missouri: 494 violent crimes per 100,000 population; 2,638 property crimes per 100,000 population.
  10. Arizona: 455 violent crimes per 100,000 population; 2,440 property crimes per 100,000 population.

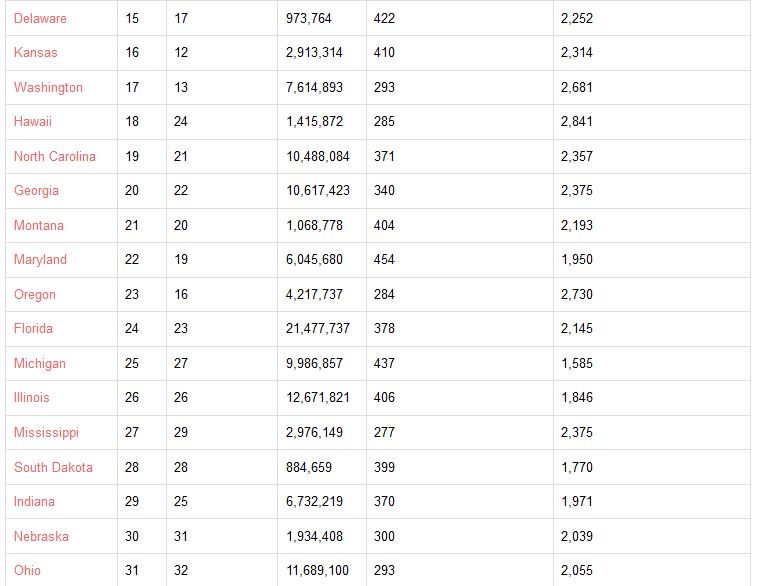
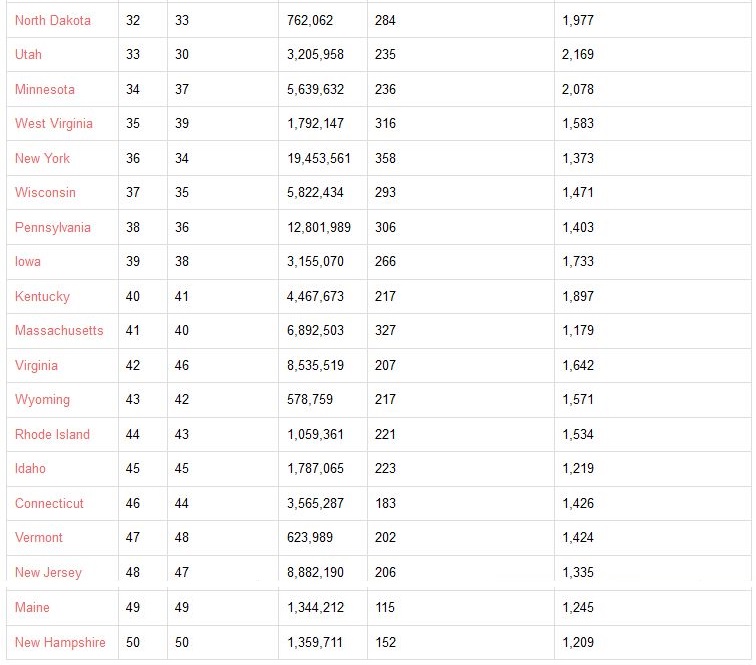
Here’s the complete list of all 50 states:

If your state is among the most dangerous, that doesn’t necessarily mean your city or town is dangerous. It depends on whether your city is among your state’s most dangerous cities. Go here to find out.

Here are America’s 10 most dangerous cities, 2021:

  1. St. Louis, Missouri
  2. Springfield, Missouri
  3. Memphis, Tennessee
  4. Little Rock, Arkansas
  5. Oakland, California
  6. Wichita, Kansas
  7. New Orleans, Louisiana
  8. Chattanooga, Tennessee
  9. North Charleston, South Carolina
  10. Cleveland, Ohio

RoadSnacks has this disclaimer:

This article is an opinion based on facts and is meant as infotainment. Don’t freak out.

~E

Epidemic of fires in Los Angeles homeless encampments

Despite Democrat-controlled cities’ indulgent policy on vagrants and homelessness, their encampments just keep growing.

Not only are the rat-infested encampments a threat to public health, now they’re a threat to public safety as well.

Take Los Angeles for example.

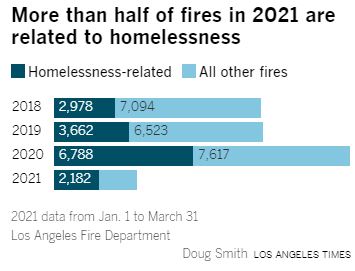
The Los Angeles Times reports on May 12, 2021, that as the number of tents, makeshift shelters and campers on Los Angeles streets has surged, so has the scourge of fire. “In the three years since the Los Angeles Fire Department began classifying them, fires related to homelessness have nearly tripled. In the first quarter of 2021, they occurred at a rate of 24 a day, making up 54% of all fires the department responded to.”

A Times analysis of records shows that fires related to homelessness have doubled in all of the department’s 14 districts since 2018, the first year of complete records. The fires were most prevalent in downtown and South Los Angeles. But the numbers were also elevated in a swath across the north side of the city from Northeast Los Angeles to the east San Fernando Valley.

A fire in 2017 was traced to a cooking fire in a ravine near Sepulveda Boulevard. The blaze spread through Bel-Air, destroying six homes and damaging a dozen others.

Although the epidemic of fires is largely attributable to the built-in conditions for combustion in street camps — cooking stoves and campfires in close proximity to tent fabric and piles of other flammable material — as much as a third of the 15,610 fires related to homelessness in the past 3 ¼ years were classified as arson, i.e., intentionally set fires.

From the LA Times:

Many fires related to homelessness are intentional. Over the three years, such fires classified as arson have steadily comprised about one-third of the total. As fires related to homelessness have increased, though, the raw number of arson fires has more than doubled, to 2,258 last year — about one of every six fires in the city. Arrests are rare — 129 and 174 over the past two years, a clearance rate of about 6%. Though few arsons are solved, limited evidence suggests that the perpetrators are most often other homeless people. Three-fourths of those arrested identified themselves as homeless….

Impossible to quantify is the dread, hostility and loss of faith in government brought on by the surge in fires. Business owners are left wondering if a random blaze will scar or destroy their property.

Preliminary results from a study released by the Fire Department show that such fires have caused $185 million in damage since 2017, 22% of all fire damage in the city. That includes $80 million in damage last year and $12 million in the first quarter of 2021.

Read the rest of the news article here.

~E

Violent crimes skyrocket in cities that defunded police

Why is this a surprise?

Citing Fox News as its source, KMJ NOW Newstalk Radio reports that crime, especially violent crime, is soaring in cities where police departments have been defunded.

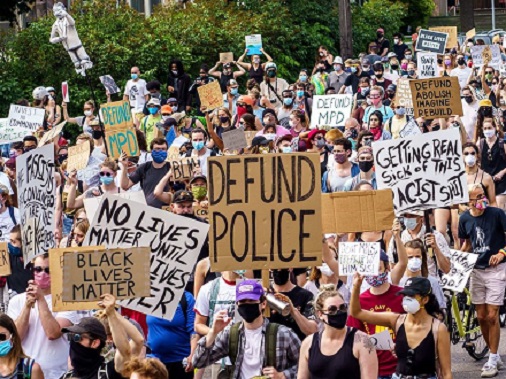
Since George Floyd died in police custody in Minneapolis, calls to defund the police erupted across America. Defunding means reallocating or redirecting funding away from the police department to other government agencies funded by the city.

More than 20 major cities have reduced their police budgets in some form. As examples:

  • Austin, Texas: The city council voted to cut roughly one-third of the city’s $434 million police budget. Councilman Gregorio Casar, who helped pass the major cut, told The Guardian,”We are showing the country how reinvestments from the police budget can actually make many people’s lives so much better and safer. This will build momentum for changes to police budgets across the country.”
  • Los Angeles, California: In July 2020, the police department’s budget was slashed by $150 million.
  • Minneapolis, Minnesota: In December 2020, the city council shifted $8 million from the police department to other programs, and in July 2021, diverted an additional $1.1 million from the police department’s $193 million budget to the Office of Violence Prevention.
  • New York City, NY: In July 2020, the City Council slashed $1 billion from the police budget, including $484 million in cuts and $354 million reallocated to other agencies ”best positioned to carry out the duties that have been previously assigned to the New York Police Department, like the Department of Education, the Department of Health & Mental Hygiene and the Department of Homeless Services.” Another $162 million was slashed through “associated costs.”
  • Portland, Oregon: In May 2020, city commissioners voted to cut nearly $16 million from the police budget in response to complaints about police force and racial injustice.

We now have the results of #DefundPolice:

  • Austin: 26% increase in aggravated assault reports in 2021 as of February, compared with the same period last year.
  • Los Angeles: 38% increase in murders in 2020; 28.3% increase in murders in 2021 through March 13.
  • Minneapolis: 46% increase in murders from Dec. 11, 2020 through March 28, 2021, compared to the same period last year.
  • New York City: 76 murders in 2021 thus far, compared with 68 from the same time period in 2020.
  • Oakland, CA: 314% in homicides and 113% increase in firearms assaults compared with the same time last year.
  • Portland, OR: 300% increase in murders from July 2020 to February 2021. In the first two months of 2021, 17 people have been murdered — a 1,600% increase from the one murder reported during the same time period in 2020.

~E