Category Archives: safety

18 of America’s 20 worst cities are run by Democrats

WalletHub compared the operating efficiency of 150 of the largest U.S. cities to determine which among them are managed best, based on a “Quality of Services” score made up of 38 metrics grouped into 6 service categories:

  1. Financial stability
  2. Education
  3. Health
  4. Safety
  5. Economy
  6. Infrastructure and Pollution

Each city’s “Quality of Services” score is then measured against the city’s per-capita budget. (To find out more about WalletHub’s methodology, go here.)

Source: WalletHub

No surprise to us, Los Angeles, CA (#134), Chicago, IL (#141), Oakland, CA (#144), Detroit, MI (#145), New York, NY (#148), San Francisco, CA (#149), and Washington, DC (#15o) are ranked among the worst — all governed by Democrats.

In fact, 18 of the 20 worst managed cities have Democrat mayors. The two exceptions are #146 Gulfport, TN (Republican mayor Billy Hewes) and #147 Chattanooga, TN (Independent mayor Tim Kelly).

But that fact won’t deter the voters of those cities to reelect Democrats, which is a sure indicator of their mental illness.

Here’s the list of the 150 cities, ranked from best (#1) to worst (#150):

Overall Rank (1=Best)  City ‘Quality of City Services’ Rank  ‘Total Budget per Capita’ Rank 
1 Nampa, ID 23 1
2 Boise, ID 4 3
3 Fort Wayne, IN 63 2
4 Nashua, NH 5 9
5 Lexington-Fayette, KY 44 6
6 Lincoln, NE 8 19
7 Durham, NC 25 11
8 Rapid City, SD 81 4
9 Las Cruces, NM 65 5
10 Virginia Beach, VA 2 36
11 Raleigh, NC 11 29
12 Missoula, MT 67 12
13 Oklahoma City, OK 88 8
14 Manchester, NH 29 20
15 Provo, UT 3 38
16 Sioux Falls, SD 31 21
17 Billings, MT 86 13
18 Madison, WI 6 42
19 Chesapeake, VA 17 34
20 Huntington Beach, CA 1 55
21 Louisville, KY 80 17
22 Greensboro, NC 57 23
23 Arlington, TX 28 31
24 Salem, OR 54 26
25 Mesa, AZ 58 25
26 Bismarck, ND 12 48
27 Charleston, SC 15 44
28 Columbus, GA 95 16
29 Cedar Rapids, IA 34 39
30 Warwick, RI 26 43
31 Albuquerque, NM 127 10
32 Tucson, AZ 111 14
33 Warren, MI 74 28
34 Huntington, WV 114 15
35 Aurora, IL 51 37
36 Phoenix, AZ 65 35
37 Grand Rapids, MI 33 47
38 Lewiston, ME 85 30
39 Tulsa, OK 110 22
40 Topeka, KS 76 40
41 Reno, NV 43 49
42 Worcester, MA 48 52
43 St. Petersburg, FL 42 54
44 Mobile, AL 96 32
45 Fort Worth, TX 56 53
46 El Paso, TX 64 50
47 Wichita, KS 124 24
48 Portland, ME 21 69
49 Corpus Christi, TX 99 41
50 Colorado Springs, CO 78 51
51 Baton Rouge, LA 129 27
52 Las Vegas, NV 49 61
53 Aurora, CO 79 56
54 Gary, IN 141 18
55 Fairbanks, AK 102 45
56 Des Moines, IA 53 62
57 Eugene, OR 38 71
58 Fort Smith, AR 123 33
59 Rutland, VT 59 67
60 Fargo, ND 35 79
61 Spokane, WA 60 68
62 San Diego, CA 7 97
63 Santa Ana, CA 39 81
64 Jackson, MS 148 7
65 Omaha, NE 27 86
66 Little Rock, AR 122 46
67 Hialeah, FL 55 78
68 Indianapolis, IN 93 60
69 Portland, OR 19 95
70 Boston, MA 14 100
71 Akron, OH 97 65
72 Montgomery, AL 119 58
73 Garland, TX 52 89
74 Salt Lake City, UT 16 106
75 Anchorage, AK 83 82
76 Tallahassee, FL 73 85
77 Fremont, CA 13 113
78 Houston, TX 100 73
79 Jacksonville, FL 109 70
80 Frederick, MD 22 108
81 Dayton, OH 101 74
82 Austin, TX 10 117
83 Columbia, SC 103 76
84 Dover, DE 120 64
85 Springfield, MA 121 63
86 Miami, FL 50 96
87 Casper, WY 104 80
88 Tampa, FL 40 101
89 Providence, RI 116 72
90 San Antonio, TX 47 103
91 St. Paul, MN 45 104
92 Columbus, OH 82 92
93 New Orleans, LA 136 57
94 San Jose, CA 20 121
95 Dallas, TX 89 93
96 Burlington, VT 32 114
97 Norfolk, VA 107 88
98 Charleston, WV 128 77
99 Bridgeport, CT 117 83
100 Richmond, VA 87 98
101 Kansas City, MO 112 91
102 Anaheim, CA 69 111
103 Cincinnati, OH 72 112
104 Fort Lauderdale, FL 41 120
105 Charlotte, NC 24 126
106 Toledo, OH 142 66
107 Orlando, FL 61 118
108 Bakersfield, CA 130 86
109 Shreveport, LA 147 59
110 Milwaukee, WI 126 90
111 Nashville, TN 105 105
112 Lubbock, TX 118 101
113 Knoxville, TN 46 130
114 Seattle, WA 9 140
115 Minneapolis, MN 37 133
116 Modesto, CA 108 109
117 Stockton, CA 145 75
118 Birmingham, AL 132 94
119 Syracuse, NY 84 123
120 Sacramento, CA 92 122
121 Pittsburgh, PA 68 129
122 Buffalo, NY 91 125
123 Riverside, CA 90 127
124 Atlanta, GA 77 132
125 Wilmington, DE 113 119
126 Fresno, CA 133 107
127 Long Beach, CA 62 139
128 Baltimore, MD 135 110
129 Cheyenne, WY 98 135
130 Denver, CO 71 141
131 Kansas City, KS 138 116
132 St. Louis, MO 149 84
133 Memphis, TN 143 115
134 Los Angeles, CA 75 143
135 New Haven, CT 137 124
136 Yonkers, NY 70 144
137 Philadelphia, PA 134 128
138 Rochester, NY 115 138
139 Tacoma, WA 106 142
140 Hartford, CT 144 131
141 Chicago, IL 140 136
142 Cleveland, OH 139 137
143 Flint, MI 146 134
144 Oakland, CA 94 147
145 Detroit, MI 150 99
146 Gulfport, MS 125 145
147 Chattanooga, TN 131 146
148 New York, NY 36 148
149 San Francisco, CA 18 149
150 Washington, DC 30 150

~E

10 most dangerous states and cities in America

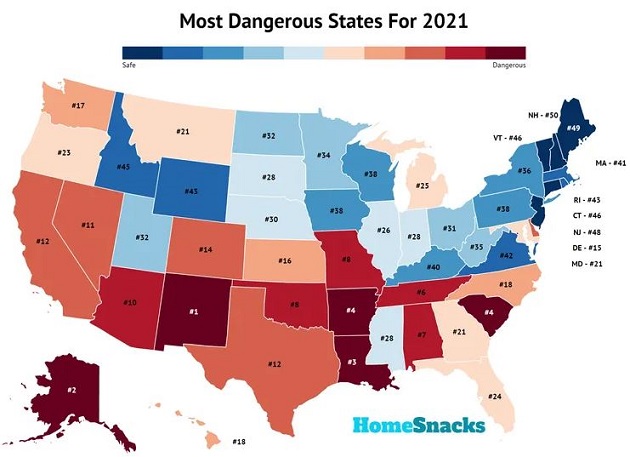
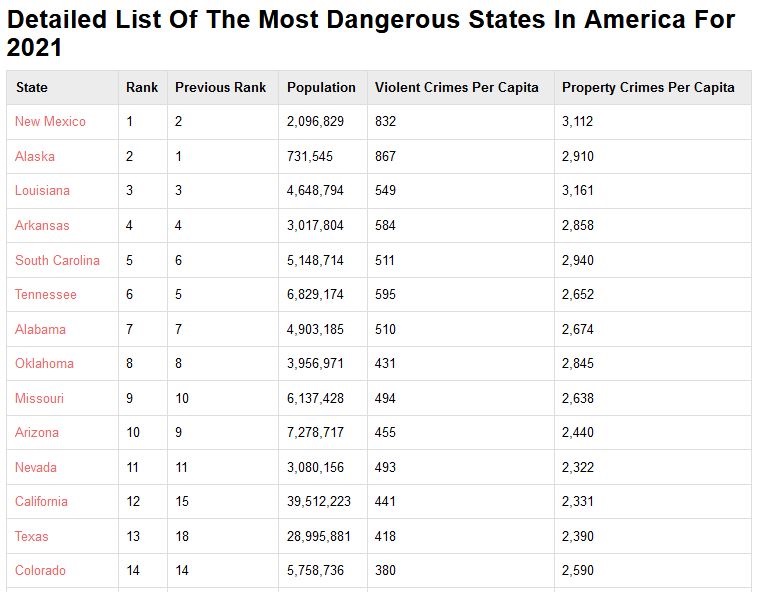
RoadSnacks has issued the 10 Most Dangerous States in America for 2021 — defined as states with the highest number of violent and property crimes per capita, according to FBI’s 2019 Crime Report. The FBI, in turn, derived its crime data from the states.

RoadSnacks‘ methodology:

  • Each state is ranked from 1 to 50 for the two criteria (violent crimes; property crimes), 1 being most dangerous.
  • The two rankings for each state is then averaged into a “Danger Index”.
  • The state with the lowest Danger Index is the most dangerous state in America for 2021.

Here’s the 10 most dangerous states in America, 2021:

  1. New Mexico: 832 violent crimes per 100,000 population; 3,112 property crimes per 100,000 population.
  2. Alaska: 867 violent crimes per 100,000 population; 2,910 property crimes per 100,000 population.
  3. Louisiana: 549 violent crimes per 100,000 population; 3,161 property crimes per 100,000 population.
  4. Arkansas: 584 violent crimes per 100,000 population; 2,858 property crimes per 100,000 population.
  5. South Carolina: 511 violent crimes per 100,000 population; 2,940 property crimes per 100,000 population.
  6. Tennessee: 595 violent crimes per 100,000 population; 2,652 property crimes per 100,000 population.
  7. Alabama: 510 violent crimes per 100,000 population; 2,674 property crimes per 100,000 population.
  8. Oklahoma: 431 violent crimes per 100,000 population; 2,845 property crimes per 100,000 population.
  9. Missouri: 494 violent crimes per 100,000 population; 2,638 property crimes per 100,000 population.
  10. Arizona: 455 violent crimes per 100,000 population; 2,440 property crimes per 100,000 population.

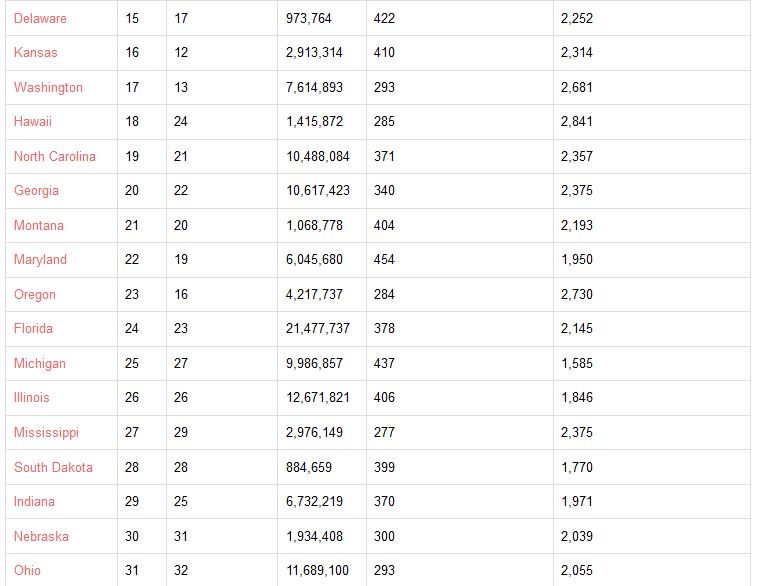
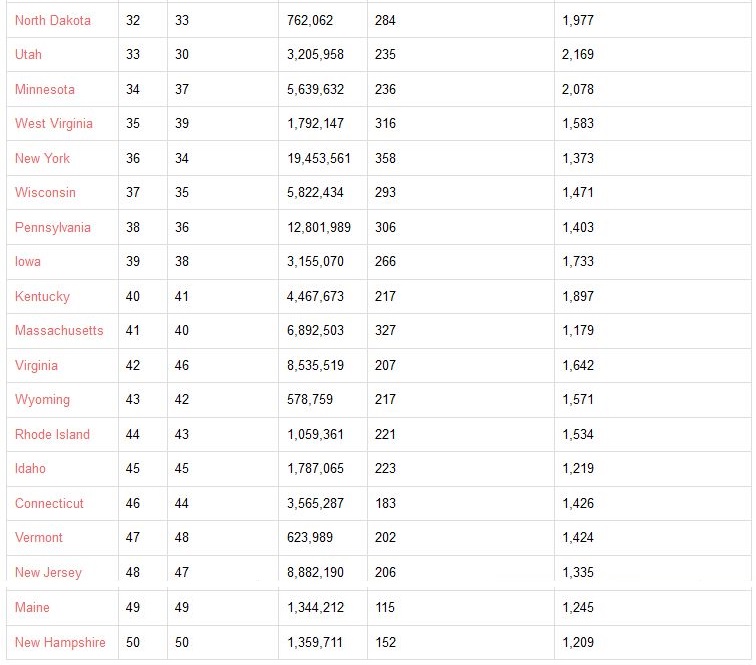
Here’s the complete list of all 50 states:

If your state is among the most dangerous, that doesn’t necessarily mean your city or town is dangerous. It depends on whether your city is among your state’s most dangerous cities. Go here to find out.

Here are America’s 10 most dangerous cities, 2021:

  1. St. Louis, Missouri
  2. Springfield, Missouri
  3. Memphis, Tennessee
  4. Little Rock, Arkansas
  5. Oakland, California
  6. Wichita, Kansas
  7. New Orleans, Louisiana
  8. Chattanooga, Tennessee
  9. North Charleston, South Carolina
  10. Cleveland, Ohio

RoadSnacks has this disclaimer:

This article is an opinion based on facts and is meant as infotainment. Don’t freak out.

~E

Saturday Funny: Petition to deny Jeff Bezos spaceflight return to earth

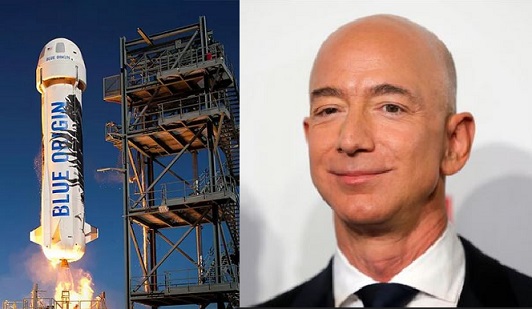
Jeff Bezos (né Jorgensen) — the billionaire with odd-sized eyes, CEO and co-founder of the extremely lucrative Amazon.com, and owner of The Washington Post — recently announced that on July 20, he will travel to space on his company Blue Origin’s first passenger flight. The suborbital flight in the New Shepard will travel to an altitude of more than 340,000 feet. (Fox News)

This is the same billionaire Bezos who:

  • Like other billionaires (George Soros, Michael Bloomberg, Carl Icahn), paid nothing in federal income taxes. ProPublica discovered that in 2011, with a then-net worth of $18 billion, Bezos not only paid no federal income tax, he had the gall to file for and received a $4,000 tax credit for his children, although households with over $100,000 in joint income weren’t eligible to receive the credit. (yahoo!news)
  • Amazon’s obsessive focus on speed comes at a huge cost to its employees, who had to urinate in plastic bottles instead of taking restroom breaks. According to a report from the Strategic Organizing Center, a labor union coalition, Amazon has a much higher warehouse injury rate than its competitors:
    • There were 6.5 injuries per 100 full time employees at U.S. Amazon warehouses in 2020 compared to 4 injuries per 100 employees at all non-Amazon warehouses.
    • The Amazon injury rate was also more than twice as high as Walmart, its largest retail competitor.
    • Amazon workers are injured more frequently than elsewhere in the warehouse sector, they are also injured more severely. Last year, there were 5.9 serious injuries per 100 Amazon warehouse workers that resulted in them missing work completely, nearly 80% higher than the wider warehouse industry.

The above, and more, no doubt prompted Jose Ortiz to create an online petition to deny Bezos’ space flight from returning to Earth.

The “Petition to Not Allow Jeff Bezos Re-Entry to Earth” says:

Jeff Bezos is actually Lex Luthor, disguised as the supposed owner of a super successful online retail store. However, he’s actually an evil overlord hellbent on global domination.

As of the writing of this post, the petition has garnered 17,008 signatures. To sign, go here. LOL

~E

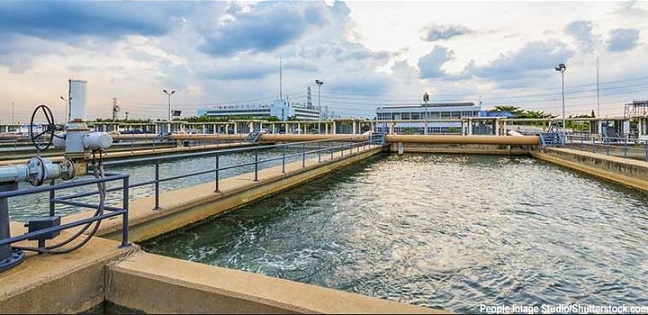
Hackers are trying to poison America’s water treatment plants

This is what Joe Biden’s proposed plan on rebuilding America’s infrastructure should address, instead of “climate change”.

Courtney Teague reports for Patch.com, June 18, 2021, that the U.S. Cybersecurity and Infrastructure Security Agency and National Security Agency recommended in July 2020 that operators of critical infrastructure take immediate action to safeguard against “foreign powers attempting to do harm to U.S. interests or retaliate for perceived U.S. aggression,” because more and more companies are shifting to remote operations and monitoring, outsource operations, and a decentralized workforce.

Already, two water treatment plants have experienced hackers trying to poison the water:

  1. NBC Bay Area reports that in January, 2021, the FBI investigated a hacker’s attempt to poison an unnamed San Francisco Bay Area water treatment plant. The hacker knew the username and password of a former employee’s TeamViewer account, which allowed them to remotely obtain access to the plant’s computers. The hacker deleted computer programs used to treat drinking water. The plant discovered it had been hacked the next day, then reinstalled the water treatment programs and changed its passwords. There were no reports of anyone being sickened by the water. NBC’s report marked the first time this incident was made public.
  2. The Washington Post reports that the same method was used in February, when an Oldsmar, Florida water plant operator watched as his computer mouse moved around his screen and opened programs, eventually raising the levels of sodium hydroxide, or lye, by more than 100 fold to a level that could cause illness and corrode pipes. As in the California water treatment plants, the hacker also used TeamViewer to gain access to the Florida employee’s screen. Fortunately, the employee quickly reversed the lye levels and water quality was not significantly impacted. Nobody was sickened.

~E

Epidemic of fires in Los Angeles homeless encampments

Despite Democrat-controlled cities’ indulgent policy on vagrants and homelessness, their encampments just keep growing.

Not only are the rat-infested encampments a threat to public health, now they’re a threat to public safety as well.

Take Los Angeles for example.

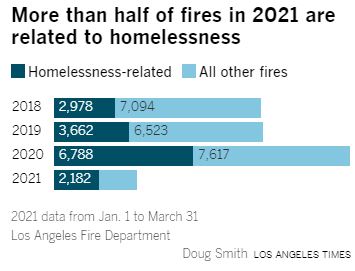
The Los Angeles Times reports on May 12, 2021, that as the number of tents, makeshift shelters and campers on Los Angeles streets has surged, so has the scourge of fire. “In the three years since the Los Angeles Fire Department began classifying them, fires related to homelessness have nearly tripled. In the first quarter of 2021, they occurred at a rate of 24 a day, making up 54% of all fires the department responded to.”

A Times analysis of records shows that fires related to homelessness have doubled in all of the department’s 14 districts since 2018, the first year of complete records. The fires were most prevalent in downtown and South Los Angeles. But the numbers were also elevated in a swath across the north side of the city from Northeast Los Angeles to the east San Fernando Valley.

A fire in 2017 was traced to a cooking fire in a ravine near Sepulveda Boulevard. The blaze spread through Bel-Air, destroying six homes and damaging a dozen others.

Although the epidemic of fires is largely attributable to the built-in conditions for combustion in street camps — cooking stoves and campfires in close proximity to tent fabric and piles of other flammable material — as much as a third of the 15,610 fires related to homelessness in the past 3 ¼ years were classified as arson, i.e., intentionally set fires.

From the LA Times:

Many fires related to homelessness are intentional. Over the three years, such fires classified as arson have steadily comprised about one-third of the total. As fires related to homelessness have increased, though, the raw number of arson fires has more than doubled, to 2,258 last year — about one of every six fires in the city. Arrests are rare — 129 and 174 over the past two years, a clearance rate of about 6%. Though few arsons are solved, limited evidence suggests that the perpetrators are most often other homeless people. Three-fourths of those arrested identified themselves as homeless….

Impossible to quantify is the dread, hostility and loss of faith in government brought on by the surge in fires. Business owners are left wondering if a random blaze will scar or destroy their property.

Preliminary results from a study released by the Fire Department show that such fires have caused $185 million in damage since 2017, 22% of all fire damage in the city. That includes $80 million in damage last year and $12 million in the first quarter of 2021.

Read the rest of the news article here.

~E